Pori Unit of the University of Tampere KIEMI project / SEINTS group Measurement time: 10.09.2020 Date of report: 12.10.2020
Introduction
As part of the KIEMI project (2019-2021) implemented by the University of Tampere’s Pori unit, the SEINTS research group, various reference systems for measuring property conditions will be tested in real operating environments. Testing will reveal the capabilities and limitations of the existing systems, which will be used in the development of prototype systems to be developed in the KIEMI project. This report deals with the signal strength study of the Aranet4 sensor unit, which was carried out at the University of Pori and its vicinity on September 10, 2020.
The signal strength study was carried out indoors at Pori University Center at Pohjoisranta 11, as well as outside the building, in order to test the maximum signal strength distance of the system. The premises of the Pori University Center in the Cotton building cover about 7000 square meters. During the signal strength testing, the base station of the Aranet4 sensor unit was located on the 3rd floor of the building in its software production laboratory (see Figure 2). The purpose of the payload study was to verify the signal strength at each measurement point, which shows how far and how strong the signal carries.
The study of the signal strength of the system was started from the 3rd floor of the university center, from where it was moved to the 2nd floor and further to the 1st floor. The report shows two images of each layer, the first of which (tabular) shows the time of measurement, temperature, relative humidity and signal strength, and the second shows the location of each measurement point on that layer. The last pair of images (Figures 7 and 8) show the measurement points outside the building and the signal strength measurement values observed in them.
In the images of the report, the signal strength is also shown in different colors, with green representing the strongest and red the weakest signal strength. In the measurements outside the building, there were also places where the signal was not heard at all, i.e., no intensity reading was obtained at all. These points are marked with a red cross in the figure (Figure 8).
The report shows the signal strength with the following indicator data (limit values / color codes).

In the following, the results of the signal strength measurement of the Aranet4 system are presented broken down by layer.
Pori University Center 3rd floor:
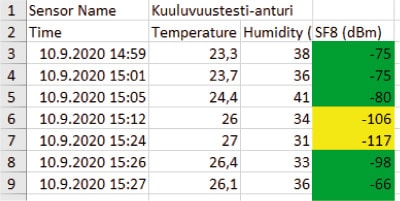
Figure 1 Measurement time, temperature, relative humidity and signal strength.
3rd floor
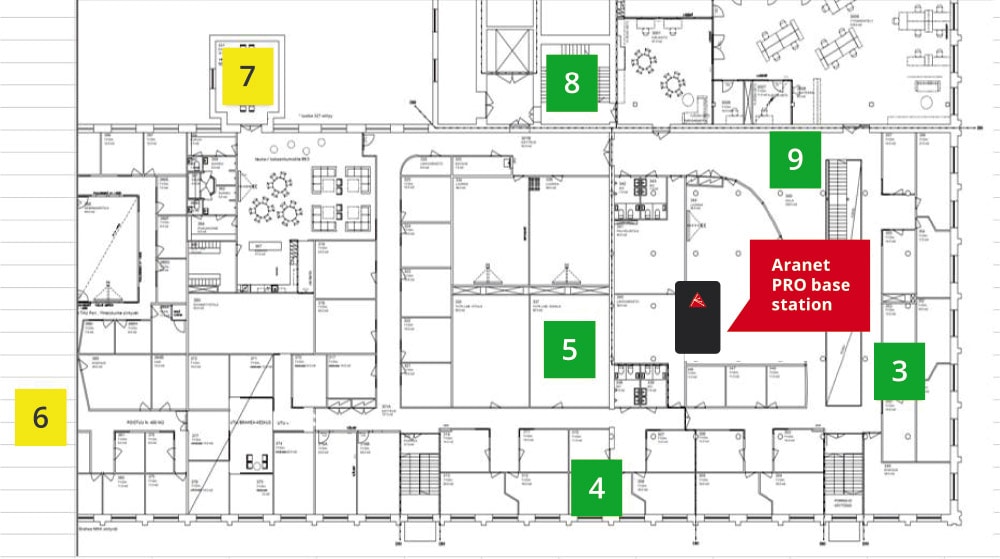
Figure 2 3rd floor floorplan and measurement points.
Summary: As can be seen from Figure 2, the signal range of the sensor unit covers the entire third layer. The signal comprehensively penetrates the entire layer structures. Measuring point 6 is located behind many glass doors and brick / chipboard walls, right in the west wing of the university center.
Pori University Center 2nd floor:

Figure 3 Measurement time, temperature, relative humidity and signal strength.
2nd floor
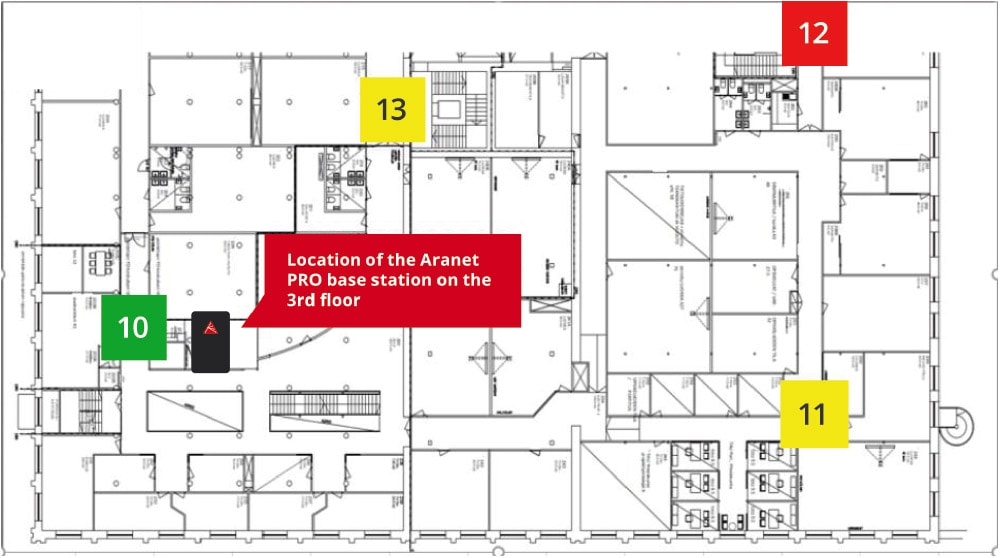
Figure 4 2nd floor floorplan and measurement points (note: bottom as a mirror image vs. Figure 2).
Summary: As can be seen from Figure 4, the range of the sensor unit covers the entire second layer. The signal comprehensively passes through the entire layer structures (base station on the 3rd floor). However, the measuring point 12 (in red) is at the extreme limits of the signal range (weak intensity -129 dbm). This measuring point is located in the north wing of the university center.
Pori University Center 1st floor:

Figure 5 Measurement time, temperature, relative humidity and signal strength.
1st floor
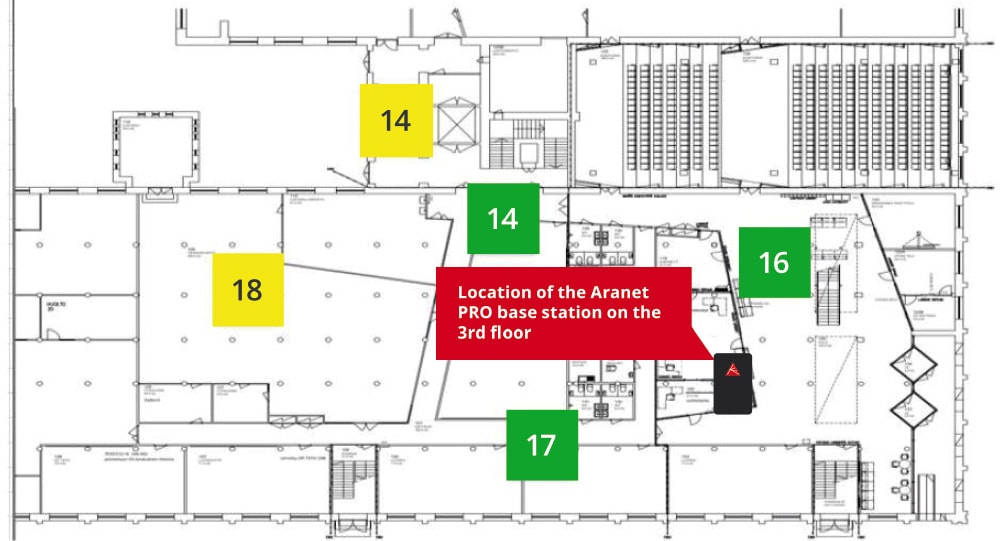
Figure 6 1st floor floorplan and measuring points.
Summary: As can be seen from Figure 6, the range of the sensor unit covers the entire first layer. The signal penetrates comprehensively, including the structures of the upper layers (base station on the 3rd floor).
Load capacity measurements outside the building:
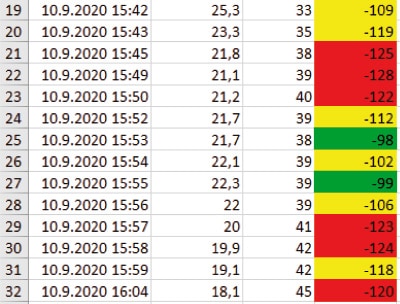
Figure 7 Measurement time, temperature, relative humidity and signal strength.
Summary: As can be seen from Figure 8, the signal range extends around almost the entire Cotton building (North Shore 11). Only in the north-west corner of the building complex does the signal disappear, but returns to sound when approaching measurement point 22. Due to the almost unobstructed “visibility”, the signal also carries quite well on the old bridge in Pori and partly the river to the other side of Pori southern shore of the initial part. As you move further south to the south shore, the signal disappears (red crosses in the picture).
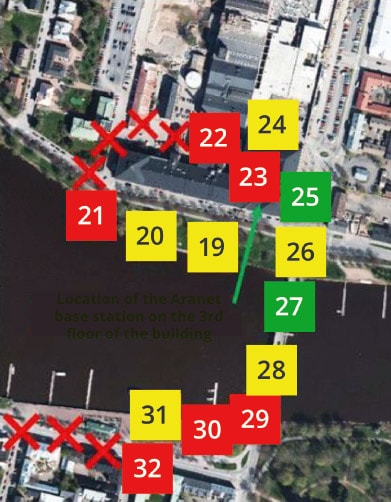
Figure 8 Satellite image with marked measurement points.
Summary
The report describes the results of the signal strength measurement of the Aranet4 sensor unit performed during the KIEMI project. The measurements were performed with the Aranet PRO base station located inside the building, in its 3rd floor laboratory space, and the signal strength was detected by moving the wireless test sensor inside and outside the building. Based on the performed signal carrying capacity measurement, it can be stated that the range of the sensor unit covers the entire 7000 square meter office space of the university center on three different floors. In addition, the distance of the signal carrying capacity from inside the building (laboratory) to the space outside it was determined, which proved to be quite far carrying under these test and measurement conditions.
However, when assessing the usefulness of the measurements, both the location of the stairway in relation to the base station (increasing the signal strength) and the location of the load-bearing brick / concrete structures of the old factory building (reducing the signal strength) must be taken into account.
Download the document here: Wireless Radio Signal Strength Report of the Aranet4
The text above is translated.